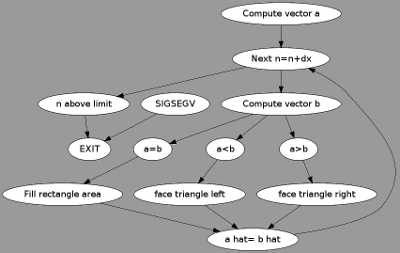
This uses graphviz to do a flowchart of the process of transporting the equations from k3d to blender. There are plenty of tutorials on the web for blender and Python so I am just hitting the highlights. This is step one and is the area under a graph converted to triangles. I could do squares easier, but I favor triangular faces. I see the flow is wrong in the diagram and so that is part of why it is done. It also shows how the code is connected, but autodoc can do that. It isn't quite as good as doing it personally though. I will post the 2D of the completed 7 dimensional structure using RGB as 3 unit*(I) vectors at x,y,z and time as number 7. Seven to two mocking 5 dimensions is not going to show much, but it just gives some vague impression of the resultant.
def Polygon2(NumberOfDims,NumberOfSides,Radius):
######### Creates a new mesh
 poly = NMesh.GetRaw()
######## Populate vertices and faces as triangles
 for i in range(0,NumberOfDims):
   for j in range(0,NumberOfDims):
     for k in range(0,NumberOfDims):
FUN DE Mental.


0 comments:
Post a Comment